This February real estate market update will help you understand the complex dynamics of San Francisco housing. If you are considering making a move, please don't hesitate to reach out for a no-pressure consultation. We're happy to help!
Look to your left. Towering overhead is the peak of a curve, a skyscraping relic from what seems like just yesterday.
This man-made mountain is a mausoleum of sorts, a resting place for the frustrations of hundreds of home sellers (and a few snarky NYT opinion pieces). It will linger forever on the landscape, another grim reminder of a very bad year.
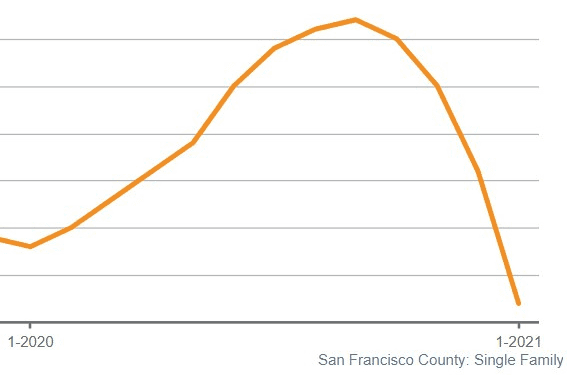
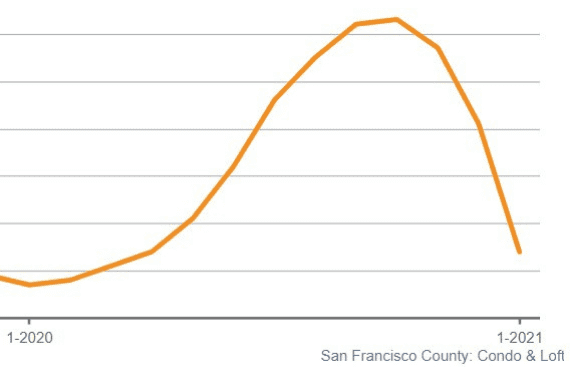
In real estate, the amount of homes for sale is tracked as "months of supply," or roughly the time it would take to sell every home currently on the market. When the COVID-19 pandemic hit, supply of listings went way up, while demand cratered. Who would buy a home when the world suddenly stopped? Few people did, in the first months of the pandemic, though some brave sellers forged ahead to list their homes. This led to the steep curve in supply seen in the charts above.
Now look to your right. The curve has crested, sloping down as steeply as it arose. The world didn’t stop forever.
By October, homebuyer demand started catching up. As of January, supply of single-family homes was back to its lowest point in three years. Supply of condos fell to mid-2019 levels, which happens to be when they reached their highest sales prices ever.
Conventional wisdom varies on where to draw the line of a "seller's market" or "buyer's market," but it’s safe to say that sellers are in a strong position if the market holds less than four months of supply. Right now, there’s only 3.4 months of condo supply on the market, and less than two months of single-family supply. We’re seeing the effects in real-time with more active buyers than sellers, and listings selling with multiple offers again.
After a brief reprieve for buyers in 2020, sellers back in the driver’s seat for now.
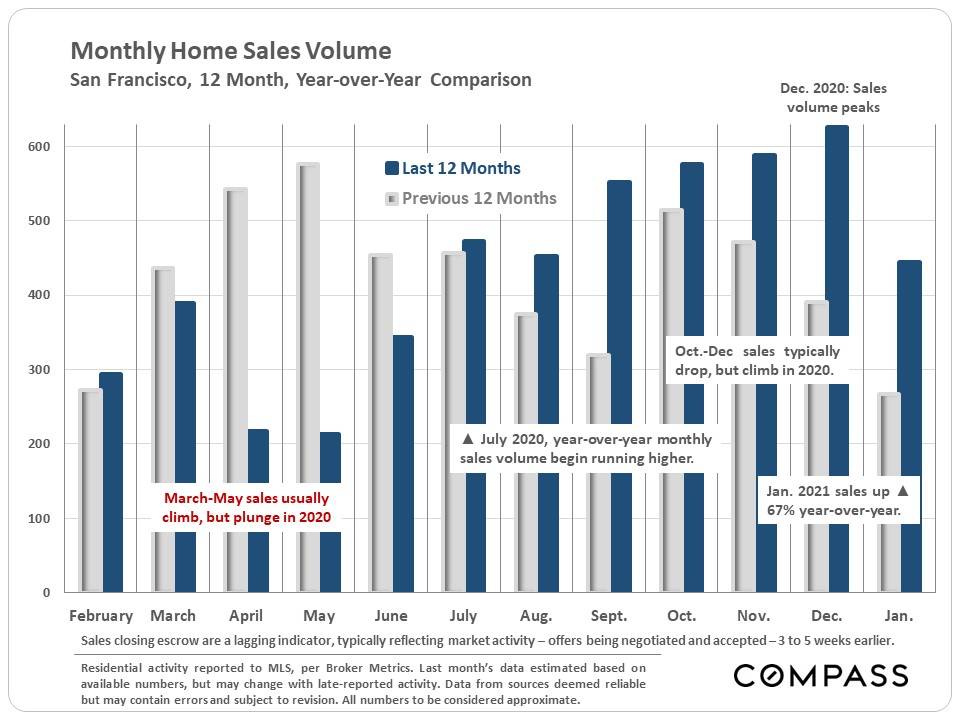
One more strange thing about last year (as if we needed another) was that, for the first time ever, San Francisco real estate sales volume peaked in December, typically the slowest month. The new year got off to a strong start too, with 67% more sales volume year-over-year in January. It’s all further evidence of the roaring resurgence in demand.
So, where do we stand now? Well, buyers are still graced with previously unheard-of, sub-3% mortgage rates. Lower rates mean increased buying power, which certainly aided in real estate’s 2020 rebound, and should continue through 2021 with rates unlikely to increase much, if at all. There’s still the pandemic to worry about, so certain types of properties remain better positioned than others to sell for top dollar.
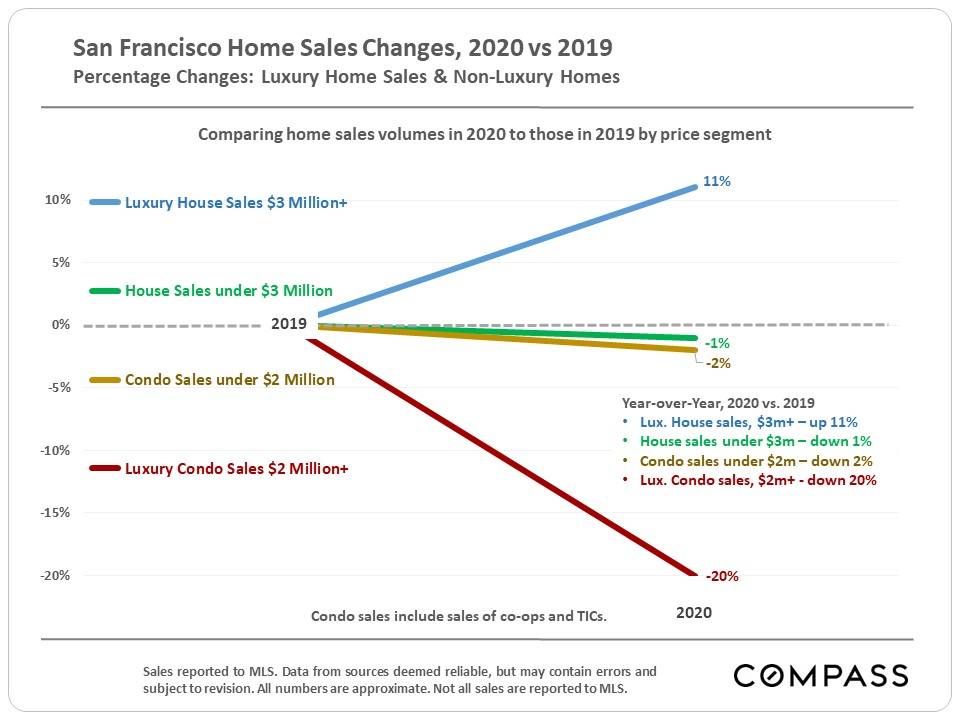
The biggest blow to the 2020 market was in luxury condos listed for over $2M. Those with the means to purchase a single-family home with nice exterior space — the new hot commodity during the pandemic — did so, rather than buying the well-appointed condo in walking distance to local hotspots that they may have considered in prior years.
For properties outside of those upper ranges, the 2020 market wasn’t much different than in 2019. Sales volume of single-family homes under $3M fell just 1% year-over-year, and sales volume of condos under $2M fell just 2%. Granted, many sellers spent more time with their listing on the market in 2020, but that tide appears to have turned.
Until enough people are vaccinated to open life back up, demand for high-end single-family homes will continue to outpace demand for high-end condos.
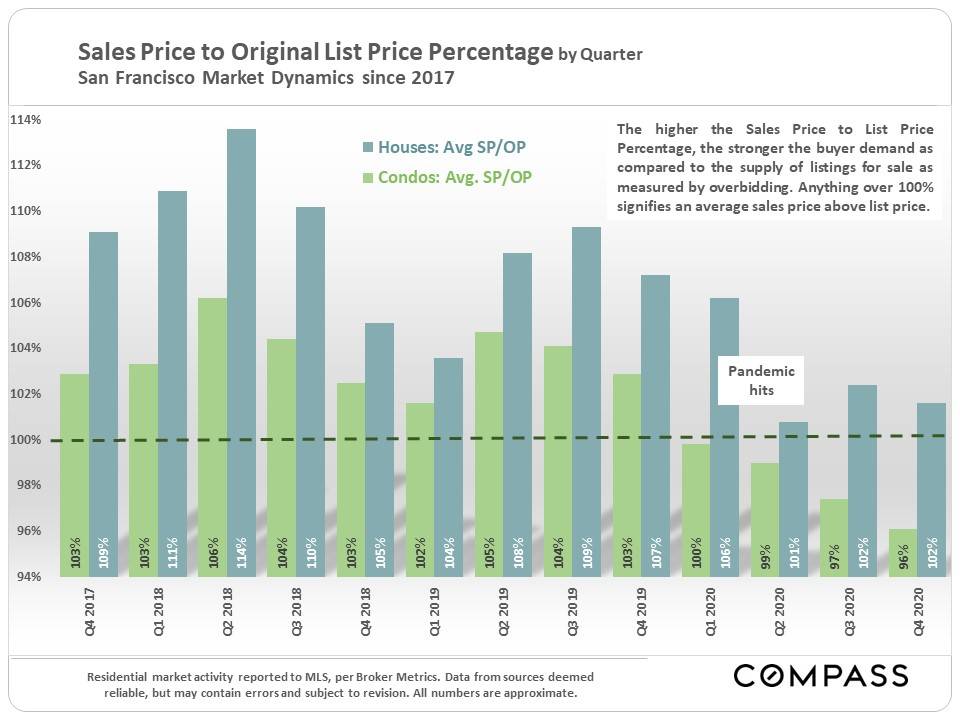
Pricing did change among all San Francisco listings in one big way last year: it shifted towards transparency.
Every real estate market has its quirks, and one of San Francisco's has historically been the trend to underprice. This strategy is invoked to attract prospective buyers, get feet in the door, and ultimately stir up a bidding frenzy. Final sales prices upwards of 20, 30 or even 50% higher than list price were commonplace... until 2020, when no one wanted "feet in the door," for obvious reasons.
In Q3 2019, sales prices averaged 109% of list price for single-family homes and 104% of list price for condos. By Q2 2020, when the pandemic struck, those figures shrank to 101% and 99% respectively. This doesn't necessarily equate to sellers receiving less money, rather than reflect everyone’s desire for an expedient sale given the circumstances.
In techie terms, 2020 saw a shift away from an eBay auction free-for-all to a “Buy It Now” model of pricing. With multiple-offer situations back on the rise, the pendulum is likely to swing back.
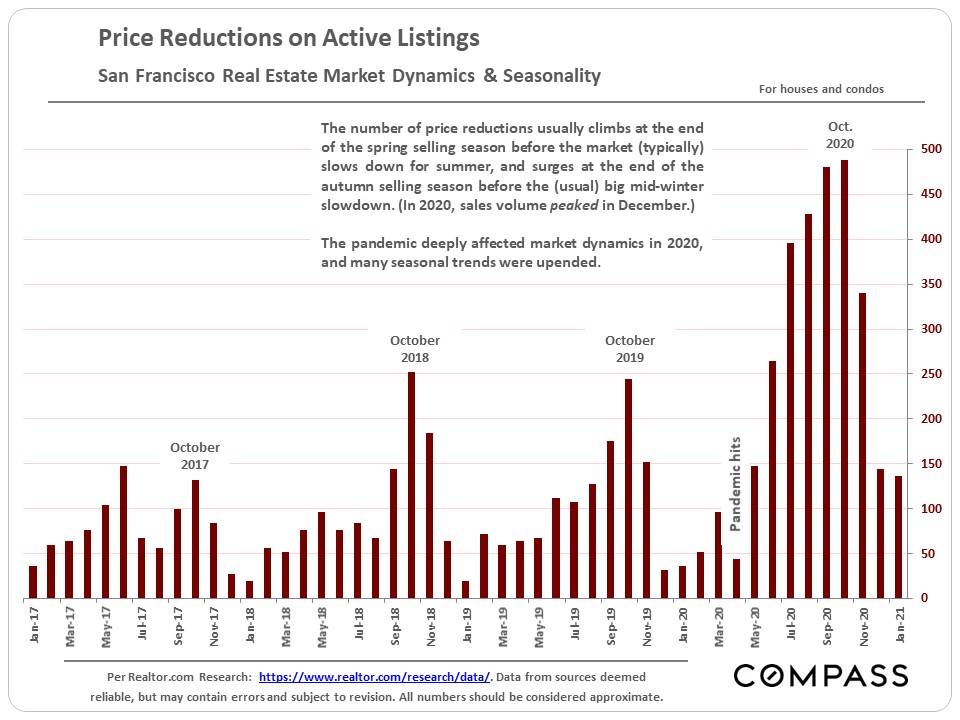
Yet another big change in 2020 was the drastic increase in price reductions. The natural ebb and flow of the market sees a gradual climb in price reductions from spring to fall, culminating in a spike in October — one last hail mary to sell before the winter slowdown. Last year, though, price reductions hit October levels by June, and they just kept coming.
The worst appears to be over, but January still had an atypically high number of price reductions. It’s no surprise in a complex, quickly evolving market. Expect the trend to continue until the market settles down, and sellers and their agents find a new equilibrium.
There’s a noticeable difference in the air here in San Francisco, and it’s not just Lysol wafting in the breeze. While this report focused largely on sellers, buyers too have a strong hand to play with mortgage rates low as they are.
If you’re thinking of buying, moving, upgrading or right-sizing, don’t miss our upcoming Zoom workshop, the 2021 Home Buyer’s Guide to San Francisco on March 5th. With an expert panel of guests, we’ll cover everything you need to know to make your plans a resounding success. Head to suitable-jaguar-dev.10web.cloud/webinar to learn more and sign up!
I’ll leave you with this fabulous interactive chart from Compass. Take care, and please reach out with any real estate questions! Talk soon.

